

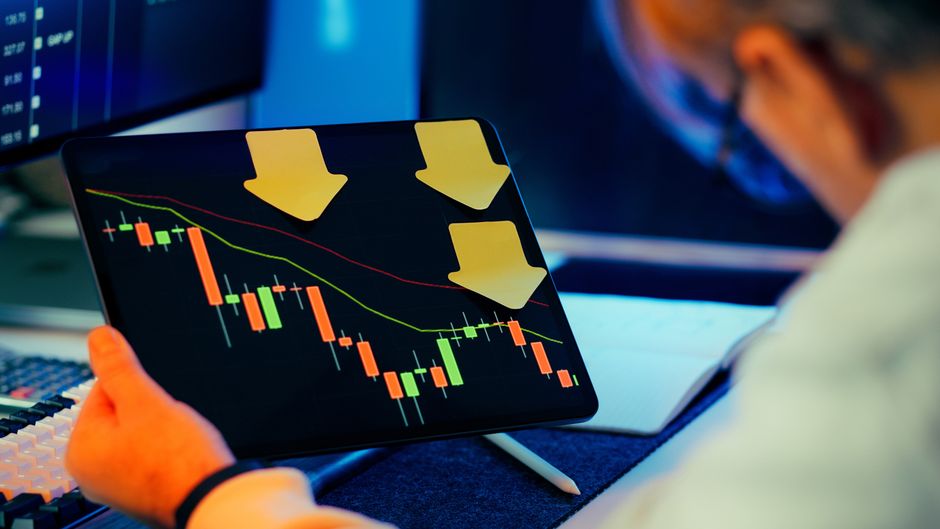
What a Business Stock Market Crash Means for Companies
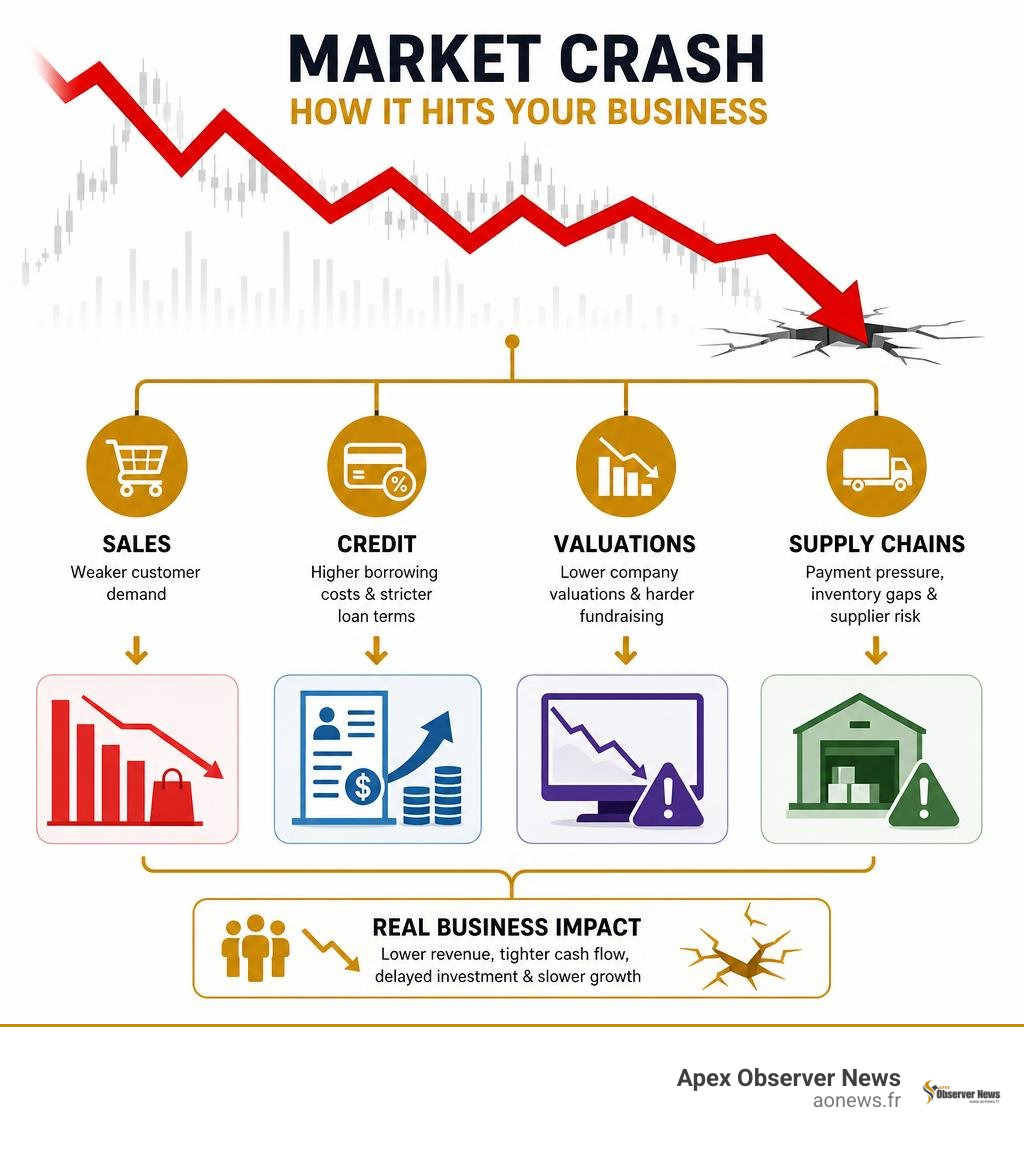
A business stock market crash is a fast, broad drop in share prices that can quickly spill into the real economy. Even private companies can feel it through weaker customer demand, tighter bank lending, lower valuations, delayed investment, and supply-chain stress.
| What breaks first | What businesses may experience |
|---|---|
| Investor confidence | Lower company valuations and harder fundraising |
| Consumer spending | Softer sales, especially for nonessential products |
| Credit markets | Higher borrowing costs and stricter loan terms |
| Business investment | Delayed hiring, expansion, and equipment purchases |
| Supply chains | Payment pressure, inventory gaps, and supplier risk |
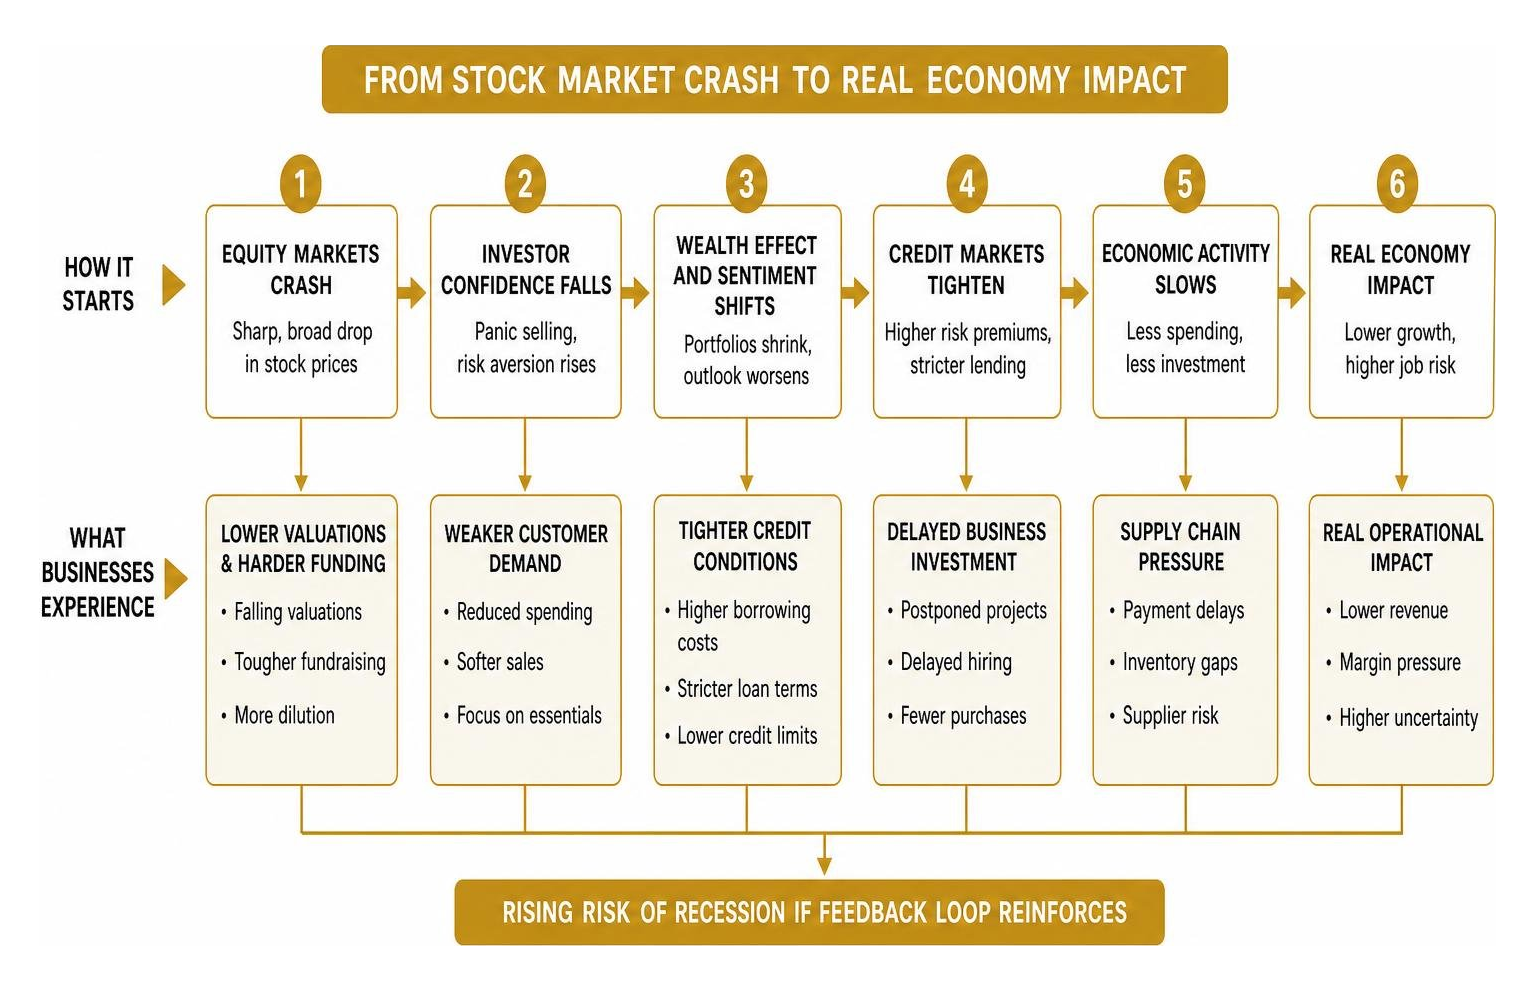
A crash is not the same as a recession, but it can help cause one when panic, falling wealth, and credit stress reinforce each other. History shows the scale can be severe: the Dow fell 22.6% in one day during Black Monday in 1987, while the S&P 500 dropped about 30% in a single month during the COVID-19 shock of 2020.
I’m Faisal S. Chughtai, founder of ActiveX, with experience in digital strategy, web operations, hosting, and business growth planning. My perspective on a business stock market crash focuses on how fast-moving financial news can affect the practical decisions companies make every day.
Simple business stock market crash glossary:
- bear market entry points
- recession risk economic indicators
- growth stock market rally
Understanding the Mechanics of a Business Stock Market Crash
When we talk about a business stock market crash, we are describing a sudden, double-digit decline in stock prices across major equity indices occurring over just a few days or weeks. Unlike a bear market—which is a prolonged downward trend that plays out over several months or years—a crash strikes like lightning. It is driven by widespread panic selling, liquidity evaporation, and an abrupt collapse in market confidence.
Financial exchanges typically define severe market volatility by tracking index thresholds. When stock indexes plummet suddenly, paper wealth vanishes into thin air. But why should non-investors or private company founders care about equity tickers in New York, London, or Tokyo? Because financial markets do not exist in a vacuum. They serve as the nervous system of the global financial system. When panic grips Wall Street, the tremor spreads to Main Street within days.
For a clearer perspective on historical market panics, you can explore The Black Monday Stock Market Crash guide, which outlines how systemic shocks ripple through financial institutions. Today, as we navigate complex modern economic shifts, tracking stock market trends shaping the economic landscape helps us understand how automated trading and geopolitical friction alter commercial operations.
Historical Echoes: From 1929 to Black Monday 1987
To understand how a business stock market crash harms modern commercial ecosystems, we must look at history. The granddaddy of all equity market crashes occurred in October 1929. Following a decade-long speculative expansion where investors bought shares on margin with as little as 10% down, the bubble burst. On Black Monday (October 28, 1929), the Dow Jones Industrial Average dropped nearly 13%, followed by another 12% fall on Black Tuesday (October 29). By mid-November 1929, the Dow had lost half its value, ultimately hitting a rock-bottom 41.22 in July 1932—an 89% decline from its peak.
The 1929 crash revealed intense structural debates within the Federal Reserve. The Federal Reserve Board favoured “direct action,” asking regional banks to curb speculative broker loans, while the Federal Reserve Bank of New York preferred raising the discount rate. Tragically, strict adherence to the international gold standard forced foreign central banks to raise interest rates as well, triggering global monetary contraction. For deeper historical detail, review this Stock Market Crash of 1929 analysis, which explains how monetary policy choices compounded economic damage.
Fast forward to October 19, 1987—Black Monday. On a single chaotic day, the Dow Jones Industrial Average plummeted 508 points, or 22.6%, destroying over $500 billion in market value instantly. Unlike 1929, the 1987 collapse was accelerated by early computerised portfolio insurance strategies designed to limit portfolio losses by automatically shorting index futures. Instead of protecting portfolios, these automated algorithms created a feedback loop of continuous automated market orders. Fortunately, aggressive liquidity injections by the Federal Reserve kept commercial banking systems operational, enabling the market to recover its previous highs in just over two years.
Modern Market Disruption: 2008, 2020, 2025, and 2026 Dynamics
In the modern era, market sell-offs have evolved alongside changing macro environments and technology. The 2008 Global Financial Crisis saw the S&P 500 fall nearly 60% over 17 months, caused by toxic subprime mortgage debt and systemic bank insolvency. Then came the March 2020 COVID-19 pandemic shock, where the S&P 500 dropped 30% in a single month—including a terrifying 12% single-day decline on March 16, 2020—before massive fiscal and monetary stimulus sparked a swift recovery.
More recently, structural supply disruptions and geopolitical conflicts have reshaped asset prices:
- The April 2025 Tariff Shock: On April 2, 2025, worldwide sweeping trade tariffs triggered an immediate market crash. The Dow lost over 1,344 points (3.22%) on day one, and U.S. markets erased over $3 trillion in paper wealth within days as corporate executives panicked over sudden supply chain cost spikes.
- The 2026 Energy and Tech Disruption: In early 2026, tech overvaluation and geopolitical warfare intersected. As AI stocks fell while oil prices surged, rising Middle East tensions and shipping disruptions in the Strait of Hormuz drove Brent crude oil past $100 per barrel.
- Artificial Intelligence Market Repricing: Tech hardware giants faced intense headwinds after software breakthroughs proved that advanced AI could be trained with fewer capital-intensive chips. Similar to how Deepseeks 6 Million Ai Breakthrough Sparks 2 Trillion Market Shock In Usa Tech rattled valuations earlier, recent market adjustments demonstrate how tech narrative shifts create single-day index dips.
Key Catalysts Behind Financial Market Meltdowns

What transforms standard market pullbacks into a chaotic business stock market crash? Financial markets exhibit what scientists call “self-organized criticality.” Think of a sandpile where single grains fall one by one: for a long time, the pile grows smoothly, but eventually, adding just one more grain causes an avalanche.
Market meltdowns occur when underlying imbalances reach a tipping point. Key triggers include:
- Unrealistic Asset Bubbles: Speculative enthusiasm pushes share valuations far beyond historical price-to-earnings norms.
- Catastrophic External Events: War, trade embargoes, or pandemic outbreaks disrupt revenue models overnight.
- High-Frequency Algorithmic Escalation: Automated trading scripts execute automated stop-loss liquidations faster than humans can react.
- Investor Herd Mentality: Psychological panic overrides fundamental analysis, forcing investors to dump shares at fire-sale prices.
Overvaluation and Narrative Engineering in Tech and Energy
In recent years, market growth relied heavily on optimistic corporate narratives surrounding emerging technology. However, when actual corporate earnings fail to keep pace with astronomical expectations, valuation multiples collapse.
Consider the recent volatility in the semiconductor and enterprise software sectors. Chipmakers dropped sharply when efficient foreign models like Moonshot’s Kimi K3 demonstrated that frontier AI capability did not require endless hardware purchases. Meanwhile, corporate heavyweights like Oracle saw market capitalizations drop nearly $600 billion from peak levels when investors realized that immense data center capital expenditures threatened near-term profit margins.
Investors often wonder whether market leaders can suffer massive pullbacks. Our analysis on whether Is Nvidia Going To Plunge 50 Or More History Offers A Very Clear Answer emphasizes that cyclical tech corrections are a standard feature of market history when capex spending normalizes. Compounding these tech pressures, Brent crude oil climbing past $100 per barrel in mid-2026 created a classic stagflation threat—raising operating costs for physical logistics while squeezing consumer purchasing power.
The Role of Trading Curbs and Circuit Breakers
Following the chaos of Black Monday in 1987, financial regulators realized that human emotion and automated algorithms could tear markets apart if left unchecked. To prevent catastrophic feedback loops, major exchanges established multi-tiered circuit breakers linked to the broad S&P 500 index.
According to standard exchange rules outlined in this Stock market crash research, trading curbs operate across three strict drop thresholds during standard operating hours:
- Level 1 Circuit Breaker (7% Index Drop): Trading across all equity exchanges is immediately halted for 15 minutes if triggered before 3:25 PM. This forced pause gives institutional investors time to review news and cool down irrational panic.
- Level 2 Circuit Breaker (13% Index Drop): If market selling continues after the resume and the S&P 500 declines 13% before 3:25 PM, trading is halted for another 15 minutes.
- Level 3 Circuit Breaker (20% Index Drop): If the index falls 20% at any point during the trading day, all equity trading is suspended for the remainder of the day, allowing clearing houses and corporate boards to evaluate risk overnight.
How Market Downturns Ripple Through Corporate Operations
When a business stock market crash occurs, the impact extends far beyond Wall Street portfolios. The loss of paper wealth triggers immediate defensive responses across corporate executive suites, commercial banks, and household checkbooks.
To illustrate how financial market drops affect operational business metrics, consider this comparison between mild market corrections and severe crashes:
| Metric / Focus Area | Standard Correction (10% – 15% Drop) | Severe Business Stock Market Crash (20%+ Drop) |
|---|---|---|
| Commercial Bank Credit | Slightly stricter lending criteria; interest rates remain stable. | Credit freezes; inter-bank lending spikes; loan approvals stall. |
| Consumer Spending Demand | Minor cutbacks on discretionary spending; core sales resilient. | Sharp reduction in consumer spending; sales plummet across sectors. |
| Corporate Hiring & Payroll | Temporary hiring freezes; non-essential open roles paused. | Widespread layoffs, wage freezes, and organizational restructuring. |
| Private Company Valuations | 5% to 10% adjustments in venture rounds; modest impact. | Severe valuation drawdowns; venture capital funding dries up. |
| Capital Expenditure (CapEx) | Expansion projects reviewed; major spending delayed slightly. | All capital investments halted; operational budgets slashed. |
How a Business Stock Market Crash Impacts Cash Flow and Credit
The most immediate operational threat during a market break is credit liquidity. During times of severe financial stress, commercial banks worry about asset degradation and default risks. Spikes in inter-bank borrowing rates signal a breakdown in bank trust.
When inter-bank lending freezes, commercial banks protect their balance sheets by pulling credit lines, canceling overdraft facilities, and tightening lending requirements. A company relying on rolling short-term credit lines to finance monthly inventory or payroll can face an immediate operational cash crisis. Understanding these dynamics is essential; reviewing The Ultimate Guide To Recession Risk Economic Indicators helps corporate managers monitor yield curves, debt spreads, and default indicators before credit conditions harden.
Supply Chain Strain, Lower Valuations, and Workforce Challenges

Beyond corporate bank accounts, market crashes create operational disruptions across supply networks and workforce culture:
- Supply Chain Bottlenecks: When equity values plunge, suppliers face working capital shortfalls. If a critical component manufacturer loses credit access, production halts. This creates a domino effect across international shipping hubs, leaving cargo containers sitting empty at ports and assembly lines stalled.
- Private Valuation Contraction: Private companies often believe they are isolated from public stock drops. However, venture capital and private equity firms price private assets relative to public comps. When public tech multiples contract by 40%, private startup valuations adjust downward immediately, leading to painful down-rounds or venture funding shortages.
- Workforce Morale and Layoffs: As executive teams scramble to cut overhead, employee layoffs become common. Mass layoffs reduce internal institutional knowledge, increase stress for remaining staff, and damage corporate culture.
Survival Strategies for Corporate Leaders and Entrepreneurs
While a business stock market crash brings severe operational stress, proactive management turns financial uncertainty into long-term market leadership. Companies that enter market drawdowns with healthy balance sheets and clear operational discipline frequently gain market share while weaker competitors stumble.
Strategic Shielding: Protecting Your Company in a Business Stock Market Crash
To protect your enterprise during equity market panics, corporate leaders should focus on five core financial tactics:
- Build a Cash Reserve Buffer: Maintain a cash cushion equal to 6 to 12 months of fixed operating expenses. Cash reserves allow companies to meet payroll without relying on emergency credit lines.
- Negotiate Extended Supplier Terms: Early in a downturn, work with key vendors to lengthen payment terms from 30 days to 60 or 90 days. Preserving working capital liquidity keeps operational flexibility intact.
- Diversify Revenue into Recurring Models: Move away from one-off transactional sales toward long-term subscription or retainer contracts. Predictable cash flow smooths out dips in discretionary customer spending.
- Focus Relentlessly on Customer Retention: Acquiring new customers during a market crash is expensive. Shift resources toward client success, loyalty initiatives, and account management to retain existing revenue accounts. Staying updated via Market Watch Todays Top Financial News Update helps executives anticipate macroeconomic shifts and adapt commercial strategy promptly.
Historical Market Recovery Patterns and Long-Term Investor Realities
It is easy to panic when headlines broadcast market losses, but history offers an encouraging lesson: equity markets have eventually recovered from every crash.
Historical data reveals striking recovery dynamics. Midterm election years structurally induce notable drawdowns—averaging a 17.5% drop since 1950—yet 12 months after a midterm market bottom, stocks have shown a 100% historical recovery rate with an average return of 31.7%.
Panic selling during market pullbacks locks in temporary paper losses into permanent financial damage. While recent bond market swings discussed in Bond And Bitcoin Selloff Leaves Stocks Unsteady highlight short-term market friction, disciplined businesses and long-term investors treat market pullbacks as opportunities to acquire quality assets at discounted prices.
Frequently Asked Questions About Market Crashes
How does a stock market crash directly impact private businesses that aren’t publicly traded?
Private businesses are connected to public markets through consumer spending, enterprise pricing models, and commercial credit channels. When public markets crash, institutional investors reprice private market assets downward, reducing venture capital and private equity funding. Additionally, commercial banks restrict business lending, making it harder for private companies to secure working capital lines. Finally, falling public equity wealth reduces overall consumer confidence, lowering sales across retail, B2B services, and industrial sectors.
What is the main difference between a stock market crash and an economic recession?
A stock market crash refers specifically to a rapid, severe drop in equity asset prices over hours, days, or weeks, reflecting sudden shift in investor risk perception. An economic recession, by contrast, is a broader macroeconomic contraction marked by two consecutive quarters of negative Gross Domestic Product (GDP) growth, accompanied by rising unemployment, falling industrial output, and reduced retail sales. While a stock market crash can trigger a recession by destroying confidence and freezing credit, crashes do not always lead to prolonged recessions.
How long do markets historically take to recover lost value after a major crash?
Recovery timelines vary significantly depending on underlying causes and monetary policy responses. Following the 2020 pandemic crash, equity indices recovered lost ground in just six months due to massive federal policy support. After Black Monday in 1987, the Dow Jones Industrial Average surpassed its pre-crash high within two years. However, structural systemic meltdowns take longer: following the 1929 crash, broad stock indices did not fully reclaim peak levels until 1954, though individual post-crash recovery rallies generated multi-hundred-percent gains along the way.
Conclusion
A business stock market crash tests the foundation of every company, but it does not have to spell disaster. By understanding the mechanics of financial market panics—from historical leverage collapses in 1929 to high-frequency algorithmic shocks, geopolitical energy spikes, and AI tech adjustments in 2026—corporate leaders can build resilient operational models.
Success during market downturns comes down to simple principles: maintaining 6 to 12 months of cash reserves, managing debt obligations, protecting customer relationships, and keeping a long-term strategic perspective. While financial headlines often fuel panic, disciplined companies use market drawdowns to streamline operations and capture market share while competitors retreat.
We at Apex Observer News are dedicated to bringing you clear, real-time insights across global markets, tech developments, and corporate strategy. Explore real-time coverage on business trends and financial news to keep your organization informed and ready for whatever the economy brings next.
