


Why Bear Market Entry Points Matter
Bear market entry points are price zones where investors begin buying or trading after a broad market has fallen, usually while protecting against the chance of further losses. A bear market is commonly defined as a decline of 20% or more from a recent high, but the best entry is rarely one perfect day at the bottom.
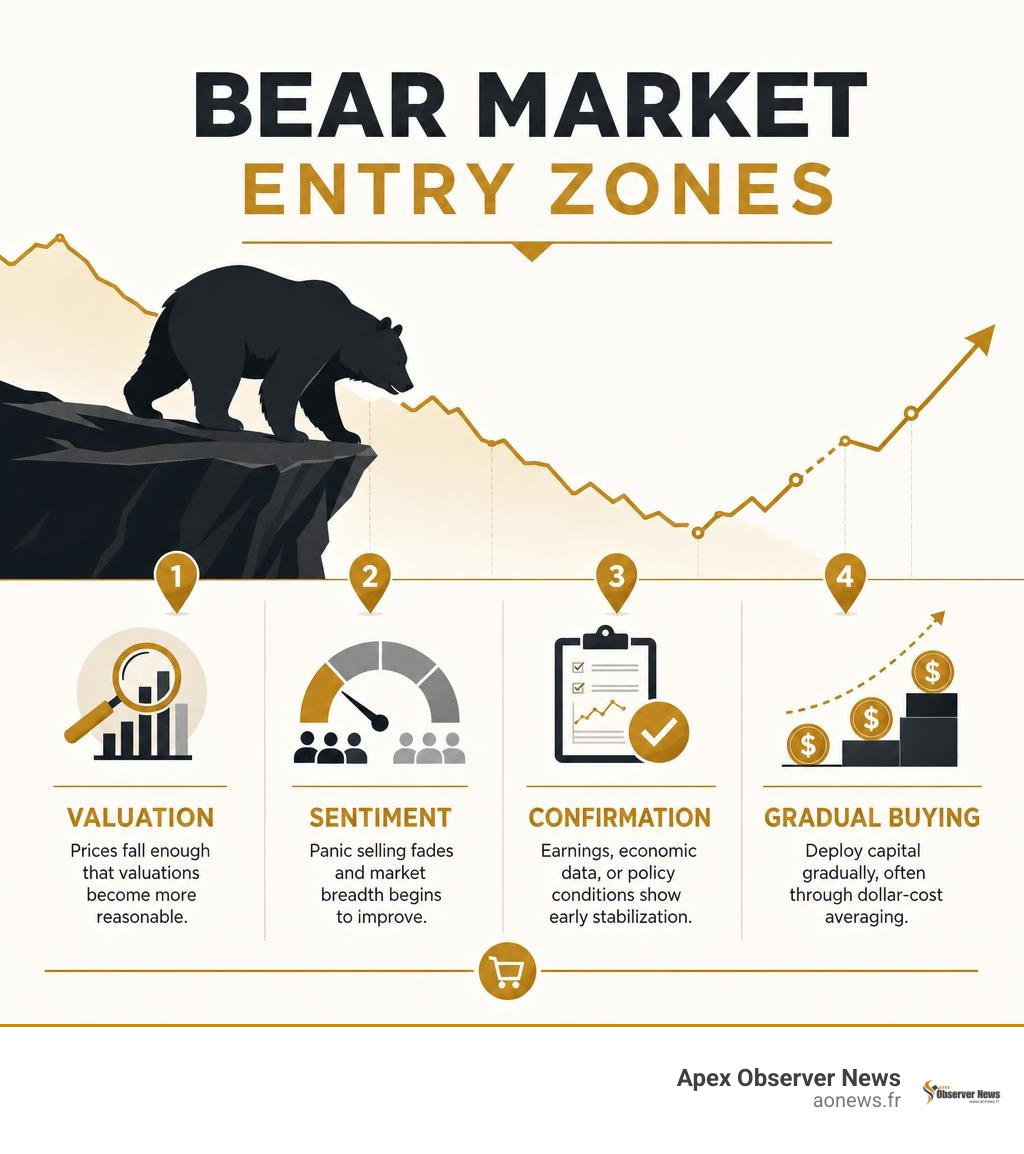
For a quick answer, look for an entry zone rather than trying to predict an exact low:
- Prices are down enough that valuations are more reasonable.
- Panic selling begins to fade and market breadth improves.
- Earnings, economic data, or policy conditions show early signs of stabilization.
- Capital is deployed gradually, often through dollar-cost averaging, instead of all at once.
History explains why this matters. Stocks have lost roughly 35% on average in bear markets, and these downturns have lasted about 289 days on average. Yet some of the market’s strongest days occur during bear markets or shortly after a new bull market starts. That makes waiting for a headline-confirmed recovery risky, but buying every dip without a plan can be just as costly.
I am Faisal S. Chughtai, founder of ActiveX, with experience in digital research, SEO, and helping audiences turn complex financial and market information into clear, usable guidance. In this guide, I examine bear market entry points through the practical lenses of market data, disciplined allocation, and investor behavior.
Must-know bear market entry points terms:
- recession risk economic indicators
- growth stock market rally
- latest stock market trends
Understanding the Anatomy of Bear Market Entry Points
When major stock indexes shed 20% or more from their peak, financial media routinely sound the alarm. However, experienced market participants view this drawdown through a structural lens. Identifying optimal bear market entry points begins with recognizing that downturns follow distinct phases rather than plummeting in a single straight line.
Historically, market declines range from cyclical corrections to multi-year secular bear markets. Since 1945, the S&P 500 has weathered 15 official bear markets, with an average drawdown of -32% and a full recovery timeline averaging 1.7 years. Between 1900 and 2018, the Dow Jones Industrial Average experienced roughly 33 bear markets, occurring approximately once every three years. Knowing these baseline statistics helps us maintain perspective when prices drop precipitously.
To build a reliable evaluation framework, we must consult resources like 10 Things You Should Know About Bear Markets alongside Understanding Bear Markets. These resources emphasize that bear market phases move from initial profit-taking at record highs to sharp capitulation, followed by quiet accumulation as institutional buyers slowly re-enter the market.
Technical Signals vs. Bear Market Rallies
One of the greatest dangers when evaluating bear market entry points is confusing a temporary “dead-cat bounce” with a true cyclical bottom. Bear market rallies can be exceptionally aggressive, luring aggressive traders back into equities right before another leg down occurs. Notably, roughly 42% of the S&P 500’s strongest single-day gains over the past 20 years took place during ongoing bear markets, while another 36% occurred during the first two months of an emerging bull market.
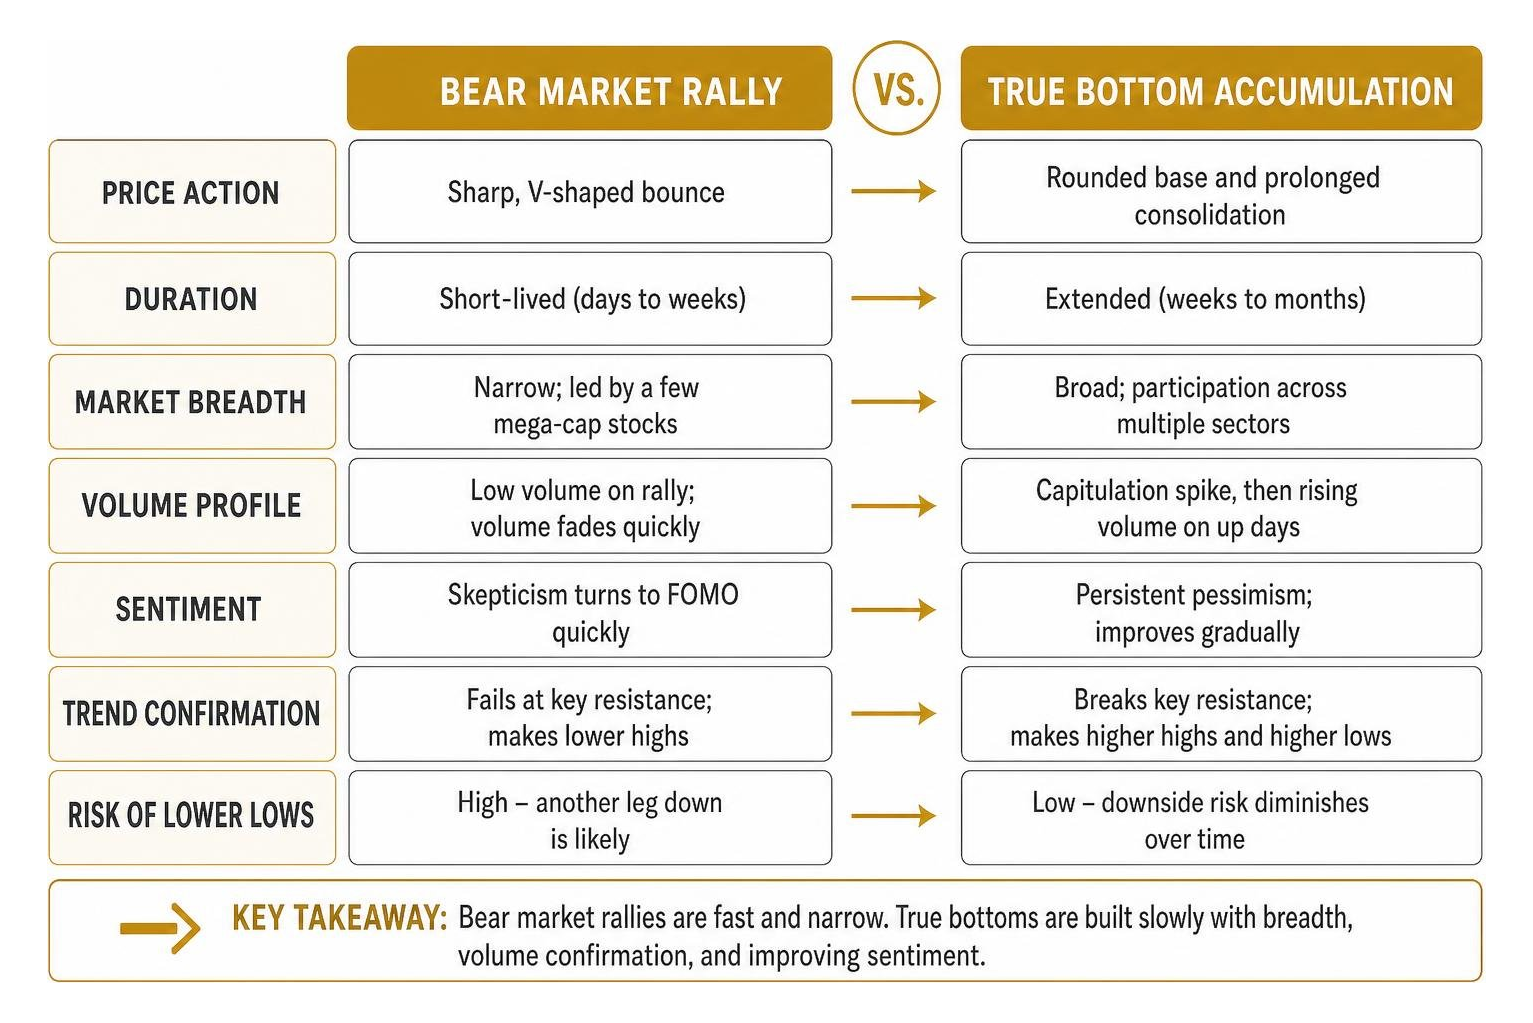
To separate temporary bounces from durable recoveries, we evaluate two critical components:
- Market Breadth: A genuine market bottom exhibits broad participation across multiple sectors, whereas a short-lived bounce is often driven by a handful of mega-cap stocks.
- Volume Profiles: Sustainable bottoms usually feature extreme capitulation volume spikes followed by rising buyer volume on subsequent consolidation days.
Understanding these technical dynamics requires a firm grasp of core financial principles. We recommend reviewing a comprehensive guide to investment basics to align your technical charting strategies with fundamental portfolio objectives.
Valuation Metrics and Economic Recessions
Market price drops alone do not automatically make equities cheap. True bear market entry points emerge when price-to-earnings (P/E) compression aligns with broader macroeconomic valuation resets. The Shiller Cyclically Adjusted Price-to-Earnings (CAPE) ratio offers a long-term view by adjusting earnings over a 10-year rolling window, mitigating short-term corporate accounting fluctuations.
Economic recessions heavily influence the duration and depth of stock market slumps. Since 1948, eight out of eleven bear markets coincided with official U.S. economic recessions. Non-recessionary bear markets tend to be shorter, averaging a median drawdown of -22% over roughly three months. In contrast, recessionary bear markets register a median decline of -35% and stretch across an average duration of 18 months. Evaluating macroeconomic reports alongside corporate earnings yields deeper context, which we explain further in the ultimate guide to recession risk economic indicators.
Quantitative and Technical Tools to Spot Bear Market Entry Points
Relying purely on instinct during market drops is a formula for poor execution. Quantitative tools and technical indicators help establish objective rules for timing long entries while controlling risk exposure.
| Technical Tool / Indicator | Primary Application in Bear Market | Key Entry Trigger | Risk Factor / Limitation |
|---|---|---|---|
| 7-Period RSI | Spotting extreme oversold conditions | Cross-under into the 15–20 zone | Whipsaws in prolonged downtrends |
| 200-Day SMA | Defining long-term market regime | Sustained price reclaim with volume | Lagging confirmation indicator |
| MACD Histogram | Tracking downside momentum exhaustion | Bullish divergence on daily chart | False bottom signals during sell-offs |
| Yield Curve Spread | Macro regime transition signal | Un-inversion of 10Y-3M spread | Historical lag of 6 to 18 months |
Identifying Oversold Conditions and RSI Indicators
Conventional trading wisdom suggests waiting for momentum indicators like the Relative Strength Index (RSI) to turn upward (cross over) above oversold thresholds before buying. However, historical backtests challenge this assumption during severe market drawdowns.
According to quantitative findings in Bear Market RSI Entries, buying immediate weakness as the 7-period RSI crosses down into deeply oversold zones frequently outperforms waiting for confirmation. For instance, backtested data over a 25-year period reveals that entering when the RSI crosses under the 15–20 zone produced an average net return of 2.06% with a profit factor of 1.65 across 567 trades using a fixed 5-day holding period.
Applying these tactical insights allows us to pair statistical edges with strict risk parameters, an approach detailed extensively in Tactical Strategies for Buying the Dip.
Evaluating Strategic Bear Market Entry Points with Moving Averages
Moving averages serve as baseline structural regime indicators. When major equity benchmarks trade beneath their 200-day Simple Moving Average (SMA), and the 50-day SMA trends below the 200-day SMA, the overall market structure remains firmly bearish.
Institutional allocators track moving average crossovers alongside macro data to determine structural risk posture. To learn more about identifying broad market structural transitions, consult How to Identify a Bull or Bear Market in 2026.
Integrating moving average regimes into daily trade planning prevents traders from aggressively buying against high-timeframe downtrends. For a foundational overview of setting platform price alerts and managing execution risk, check out our guide on stock market online trading 101.
Practical Capital Allocation Strategies for Bear Markets
Having clear entry signals is only half the battle; managing capital deployment determines whether a portfolio withstands ongoing market volatility.

Executing Dollar-Cost Averaging and Cash Management
Deploying capital all at once during a bear market introduces substantial knife-catching risk. A more resilient method is dollar-cost averaging (DCA), where capital is divided into fixed tranches deployed on a predetermined monthly schedule or at key valuation triggers.
Cash management plays an equally crucial role. During extended high-interest environments, holding dry powder in liquid money market funds earning steady yields protects capital while waiting for compelling entry opportunities. Record inflows pushed global money market funds to $7.3 trillion, with retail investors holding roughly $2.1 trillion in high-yield cash equivalents.
Guidance from Holding Cash in Case a Bear Market Hits highlights the importance of creating a systematic buying schedule for high-yield cash reserves as market valuations drop.
This structured allocation process applies across asset classes, including digital assets. For instance, How to Buy and Invest in Bitcoin in 2026 explains how combined DCA rules and on-chain metrics like the MVRV Z-Score offer a disciplined roadmap for navigating crypto market drawdowns.
Sector Rotation and Defensive Asset Classes
Not all sectors decline equally during market sell-offs. Rotating capital into defensive equities can stabilize portfolio performance during macro downturns.
Key defensive sectors include:
- Consumer Staples: Companies providing essential daily items sustain revenue and steady cash flows regardless of economic conditions.
- Healthcare & Pharmaceuticals: Inelastic demand for medical services provides a buffer against broader economic slowdowns.
- Dividend Aristocrats: High-quality firms with consistent dividend growth provide reliable cash distributions during market drops.
Across equities and digital assets, recognizing broader capitulation signals remains central to finding value, as analyzed in Bear Market Bottom Recognition.
Macro Policy Interventions and Long-Term Investor Frameworks
Macroeconomic policy moves often serve as catalyst signals for major market turns. Central bank decisions and government stimulus measures frequently mark structural inflection points in long-term equity cycles.
Navigating Macro Recessions and Federal Reserve Rate Pivots
Central bank rate cuts are historically viewed as bullish signals, but their short-term impact depends on economic context. Initial rate cuts during an emerging recession often reflect economic distress, causing equities to decline further before establishing a durable floor.
A key yield curve metric to track is the spread between 10-year and 3-month Treasury yields (FRED T10Y3M). Inversions in this curve have preceded seven of the last eight U.S. recessions. The subsequent un-inversion of the yield curve—occurring as central banks cut short-term rates—frequently coincides with the final capitulation phase of a bear market, establishing prime bear market entry points.
Staying informed on macroeconomic shifts and evolving central bank policies is essential for navigating market dynamics, as explored in stock market trends that are shaping 2026.
Long-Term Investing Frameworks for Bear Market Entry Points
For long-term investors, market downturns represent valuation compression opportunities for world-class companies. Historical data shows that since 1871, 95% of equity market drawdowns return to breakeven within 3 to 4 years (averaging 43.7 months) for diversified portfolios.
As detailed in the BEAR MARKET SURVIVAL GUIDE, maintaining an optimistic long-term bias grounded in rule-based capital deployment allows investors to capture compounding gains as new economic expansion cycles take hold. Keeping track of real-time corporate earnings news and policy announcements through market watch todays top financial news update helps ensure allocation decisions remain aligned with high-timeframe trends.
Behavioral Discipline: Avoiding Pitfalls When Timing Entries
Managing behavioral finance traps is just as vital as mastering technical indicators when entering bear markets. Emotional reactions frequently cause investors to buy at local peaks and panic sell at market bottoms.

Overcoming Loss Aversion and Panic Buying
Loss aversion—the psychological tendency to feel the pain of losses twice as strongly as the pleasure of equivalent gains—often leads investors to commit major execution errors:
- Panic Selling at the Lows: Liquidating positions during capitulation spikes locks in real losses right before relief rallies occur.
- Fear of Missing Out (FOMO) Buying: Chasing aggressive bear market rallies without confirmation leads to buying at localized resistance levels right before another sell-off.
Establishing fixed position sizing rules (such as capping individual stock tranches at 2% to 5% of total portfolio value) helps reduce the emotional impact of market swings.
Eliminating Emotional Biases in Volatile Markets
To maintain discipline when trading through volatile markets, we recommend three behavioral rules:
- Implement a Mandatory 24-Hour Cooling-Off Rule: Delay executing unplanned trades for at least 24 hours following severe red market days to avoid emotional impulse orders.
- Maintain an Investment Journal: Record the explicit fundamental or technical thesis, position size, and expected time horizon for every entry before placing the order.
- Use Rule-Based Orders: Pre-set limit orders at key valuation levels to execute trades automatically, removing real-time emotional hesitation.
Frequently Asked Questions about Bear Market Entry Points
How do you differentiate a bear market rally from a true market bottom?
A bear market rally typically features low trading volume, narrow participation centered on a few mega-cap stocks, and deteriorating macroeconomic metrics. Conversely, a true market bottom is characterized by extreme volume capitulation, broad sector participation, yield curve un-inversion, and quarterly earnings stabilization across broad equity indexes.
What is the safest strategy for entering a bear market?
The safest capital entry strategy is scaling into positions gradually via dollar-cost averaging (DCA). By deploying cash in fixed monthly tranches or at pre-defined index valuation markdowns (such as every 5% drop below a 20% drawdown threshold), investors smooth out their average acquisition cost while maintaining defensive cash reserves in yield-bearing money market funds.
How long does it usually take for equities to recover from a bear market?
Since World War II, the average S&P 500 bear market has taken approximately 11 months (289 to 355 days) to reach its absolute bottom, with a full recovery back to previous record highs averaging roughly 1.7 years. Broad multi-asset portfolios historically reach breakeven within 3 to 4 years (averaging 43.7 months) across 95% of major market downturns since 1871.
Conclusion
Finding optimal bear market entry points requires replacing emotional reactions with a structured framework built on data, disciplined capital deployment, and technical validation. While pinpointing the precise day or dollar amount of a market bottom remains practically impossible, buying quality assets within historically compressed valuation zones positions long-term portfolios for substantial compounding growth as market cycles turn.
By combining dollar-cost averaging, momentum metrics like RSI oversold zones, and tracking macroeconomic policy shifts, investors can navigate volatile downtrends with clarity and composure. Explore more business headlines on Apex Observer News to stay informed with real-time market updates, expert analysis, and actionable financial coverage.
