

What Pick 3 Lottery Patterns Can and Cannot Tell You
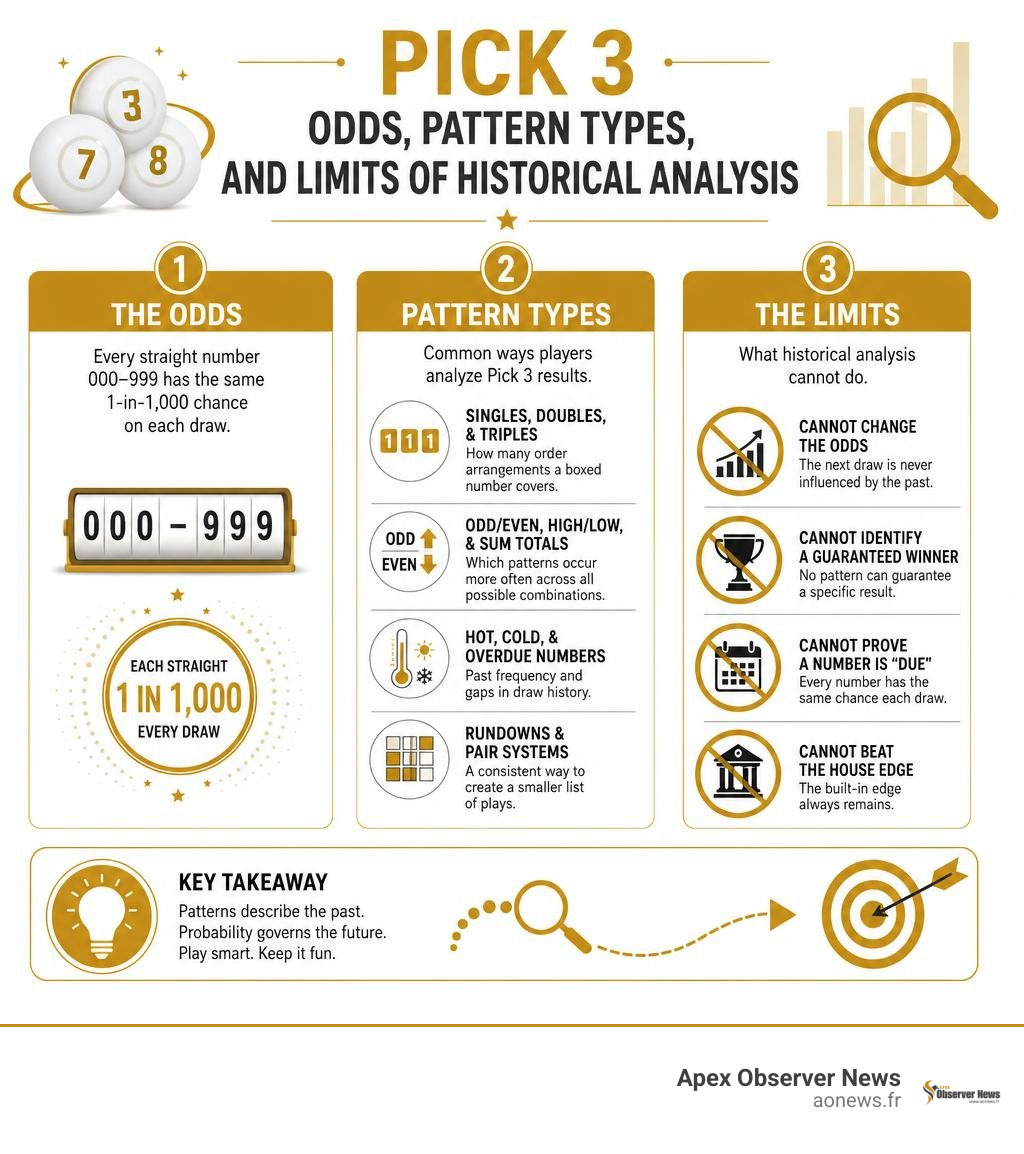
Pick 3 lottery patterns can help you understand how three-digit draws are structured, but they cannot make a random draw predictable. Every straight number from 000 through 999 has the same 1-in-1,000 chance on each draw, regardless of what appeared yesterday.
| Pattern or method | What it can show | What it cannot do |
|---|---|---|
| Singles, doubles, and triples | How many order arrangements a boxed number covers | Change the odds of the next draw |
| Odd/even, high/low, and sum totals | Which patterns occur more often across all possible combinations | Identify a guaranteed winner |
| Hot, cold, and overdue numbers | Past frequency and gaps in draw history | Prove that a number is “due” |
| Rundowns and pair systems | A consistent way to create a smaller list of plays | Beat the fixed house edge |
Pick 3 is simple on the surface: three positions, ten possible digits per position, and 1,000 possible straight outcomes. The useful part of pattern analysis is not prediction. It is knowing the difference between a six-way box, a double, a common sum range, and a claim that merely looks convincing after the fact.
This guide separates sound probability from popular lottery workouts, so you can analyze historical results without confusing a past trend for a future promise.
I am Faisal S. Chughtai, founder of ActiveX, with experience in data-focused web development, SEO, and digital content systems; I approach Pick 3 lottery patterns as an exercise in clear statistics, not false certainty. Next, we will start with the odds and wager types that shape every Pick 3 decision.
Quick Pick 3 lottery patterns definitions:
- one battle after another reviews
- amps reviews
- yp reviews
Understanding Odds, Bet Types, and Digit Classifications in Pick 3 Lottery Patterns
When we look closely at Pick 3 lottery patterns, our journey begins with the mechanics of the game. A standard Pick 3 draw selects three digits from 0 through 9 with replacement. This creates exactly 1,000 possible straight outcome permutations (ranging from 000 to 999). Every individual sequence possesses an identical statistical probability of 1 in 1,000 (0.1%) per drawing.
However, players can wager on these outcomes using different bet types. The two primary wagers are straight bets and box bets.
- Straight Wager: You must match the three digits in the exact order drawn. Because there is only one winning permutation out of 1,000, the odds are 1 in 1,000. A standard $1 wager yields a typical payout of $500, giving the bet an expected value (EV) of $0.50 per dollar wagered.
- Box Wager: You win if your selected digits are drawn in any order. The odds and payouts depend heavily on whether your combination consists of unique digits or duplicated digits. Across all 1,000 straight combinations, there are exactly 220 unique box combinations.
To compare how wager types impact statistical returns, consider the table below:
| Bet Type | Combinations Covered | Odds of Winning | Typical $1 Bet Payout | Expected Value (EV) per $1 |
|---|---|---|---|---|
| Straight | 1 Permutation | 1 in 1,000 | $500 | $0.50 |
| Single Box (6-Way) | 6 Permutations | 1 in 167 (approx.) | $80 | $0.48 |
| Double Box (3-Way) | 3 Permutations | 1 in 333 (approx.) | $160 | $0.48 |
| Triple Box | 1 Permutation | 1 in 1,000 | $500 | $0.50 |
Across all standard Pick 3 formats, the baseline house edge remains essentially constant—returning around 50 cents on the dollar over long samples. For comprehensive charts mapping every single digit permutation to its box counterpart, resources like the Pick 3 Combinations Chart – Lottery Post offer exhaustive visual listings.
Singles, Doubles, and Triples Frequency
To categorize Pick 3 lottery patterns, mathematicians divide the total pool of 1,000 outcomes into three distinct digit classifications based on duplicate numbers:
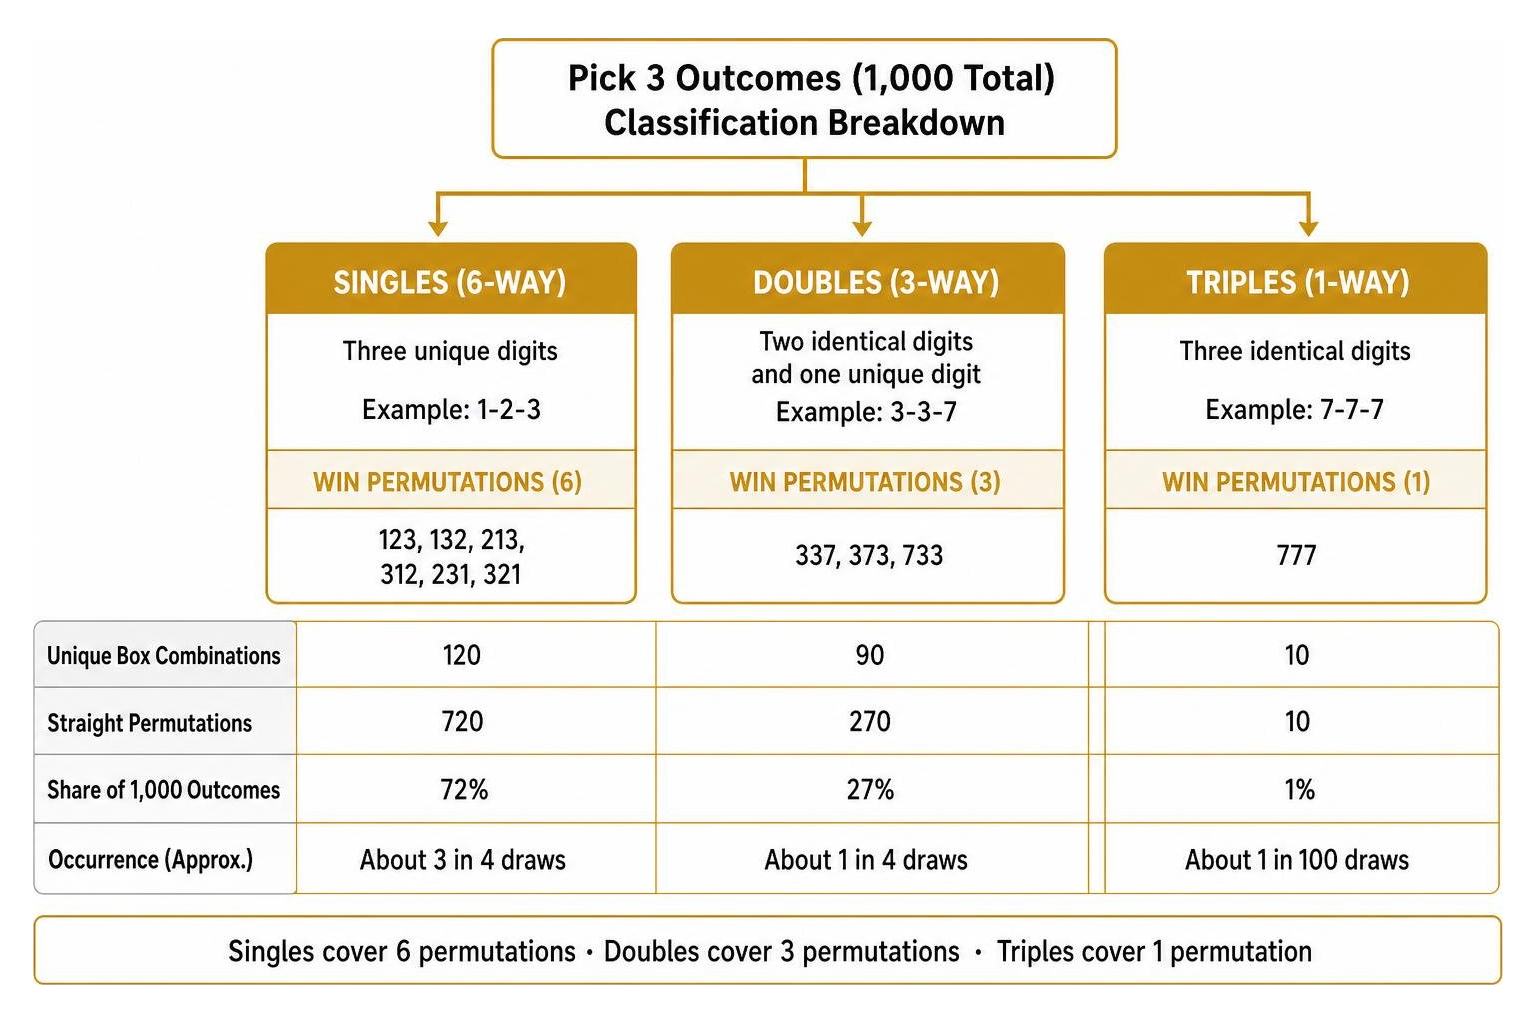
- Singles (6-Way Combinations): These combinations contain three entirely unique digits (e.g., 1-2-3, 5-6-7). Wagering on a 1-2-3 box wins if the draw produces 123, 132, 213, 312, 231, or 321. There are 120 unique single box combinations, which encompass 720 straight permutations (72% of the overall pool).
- Doubles (3-Way Combinations): These combinations feature two identical digits and one unique digit (e.g., 3-3-7, 5-1-5). A 3-3-7 box covers three straight permutations (337, 373, and 733). There are 90 unique double box combinations, accounting for 270 straight permutations. Therefore, exactly 27% of all Pick 3 draws naturally result in a double digit outcome.
- Triples (1-Way Combinations): These combinations consist of three identical digits (e.g., 0-0-0, 7-7-7). There are only 10 total triple combinations (10 straight permutations), making up just 1% of the overall pool. Because a triple has no alternative orderings, it cannot function as a 3-way or 6-way box; playing a triple in box form is functionally identical to a straight play with 1-in-1,000 odds.
Because doubles occur in 27% of draws (roughly 1 in every 4 drawings) while offering double the payout of a 6-way single ($160 vs $80 on a $1 ticket), targeting doubles is a popular structural approach among experienced analysts, as noted in the Pick 3 Strategies That Actually Work (Backed by Real Data) | DrawAnalytics Lottery Blog .
Historical Draw Patterns: Odd/Even and High/Low Balance
Beyond single/double classifications, digit balance filters offer valuable perspective on how numbers naturally aggregate across large draw histories. When we evaluate digits by parity (Odd: 1, 3, 5, 7, 9 vs. Even: 0, 2, 4, 6, 8) and magnitude (Low: 0–4 vs. High: 5–9), clear theoretical distributions emerge:
- Low/High Balance: Across the 1,000 combination matrix, numbers that are pure low (all 0–4) or pure high (all 5–9) represent only 125 combinations each (12.5% individually, or 25% combined). The remaining 75% of combinations consist of balanced 2:1 or 1:2 low-to-high ratios.
- Odd/Even Balance: Similar to magnitude, combinations featuring all-odd or all-even digits account for only 15% of total combinations. The vast majority (85%) feature a mixed ratio of 2-odd/1-even or 1-odd/2-even.
Tracking these structural baselines prevents players from over-investing in extreme patterns that naturally hit far less often. Regional resource hubs, such as our Texas Lottery Pick 3 Guide, explain how state-level game rules interact with these mathematical frameworks.
Analyzing Statistical Filtering Techniques and Overdue Numbers

When analyzing Pick 3 lottery patterns, players frequently attempt to reduce the 1,000-combination field down to a manageable shortlist. Rather than picking numbers at random, statistical filtering applies specific mathematical criteria to eliminate combinations that belong to rare tail-end distributions.
Three of the most common data-backed filters include:
- Sum Range Filtering: Adding the three drawn digits together yields a sum between 0 (0+0+0) and 27 (9+9+9). The mathematical sum distribution forms a bell curve centered around 13.5. The sum range of 10 through 17 contains roughly 500 combinations—meaning approximately 50% of all Pick 3 draws land within this tight 8-point window. Sums 13 and 14 are the most frequent, each containing 75 straight combinations (7.5% of total combinations each).
- AC Value (Absolute Complexity): AC value measures the number of distinct differences between digits in a combination. In Pick 3, 95% of all historical winning numbers exhibit an AC value of 2 or 3. Combinations with an AC value of 1 (such as sequential numbers or triples) represent a tiny fraction of total draws.
- Digit Group Distribution: If we split the 10 digits into three distinct groups (Group A: 0–2, Group B: 3–5, Group C: 6–9), the statistical odds of all three drawn digits coming from a single group are only about 5%. Filtering out single-group bets automatically eliminates combinations that align poorly with standard random dispersion.
Systematic strategy guides like Best 16 Strategies to Winning Pick 3 Lottery(2022 Updated) – SamLotto frequently rely on these filters to trim play slips without sacrificing coverage of the central distribution curve.
Positional Frequency Analysis and Hot vs. Cold Numbers
Another widely used analytical method is positional frequency analysis. Instead of counting how often a digit appears overall across all three slots, positional frequency isolates digit performance slot-by-slot (Position 1, Position 2, and Position 3).
In a fair lottery, each digit has a theoretical 10% baseline probability per position. However, over real-world sample sizes (such as 100 to 1,000 draws), positional heatmaps reveal observable variance:
Evaluating Popular Workouts: Rundowns, AKDPS, and Pair Systems

Lottery players have developed various manual workouts designed to generate candidate lines from recent winning results. While these mathematical systems provide a structured methodology for choosing numbers, it is essential to remember that no mathematical formula applied to past numbers can alter the random physics of future draws.
Among the most popular traditional workouts are rundown systems:
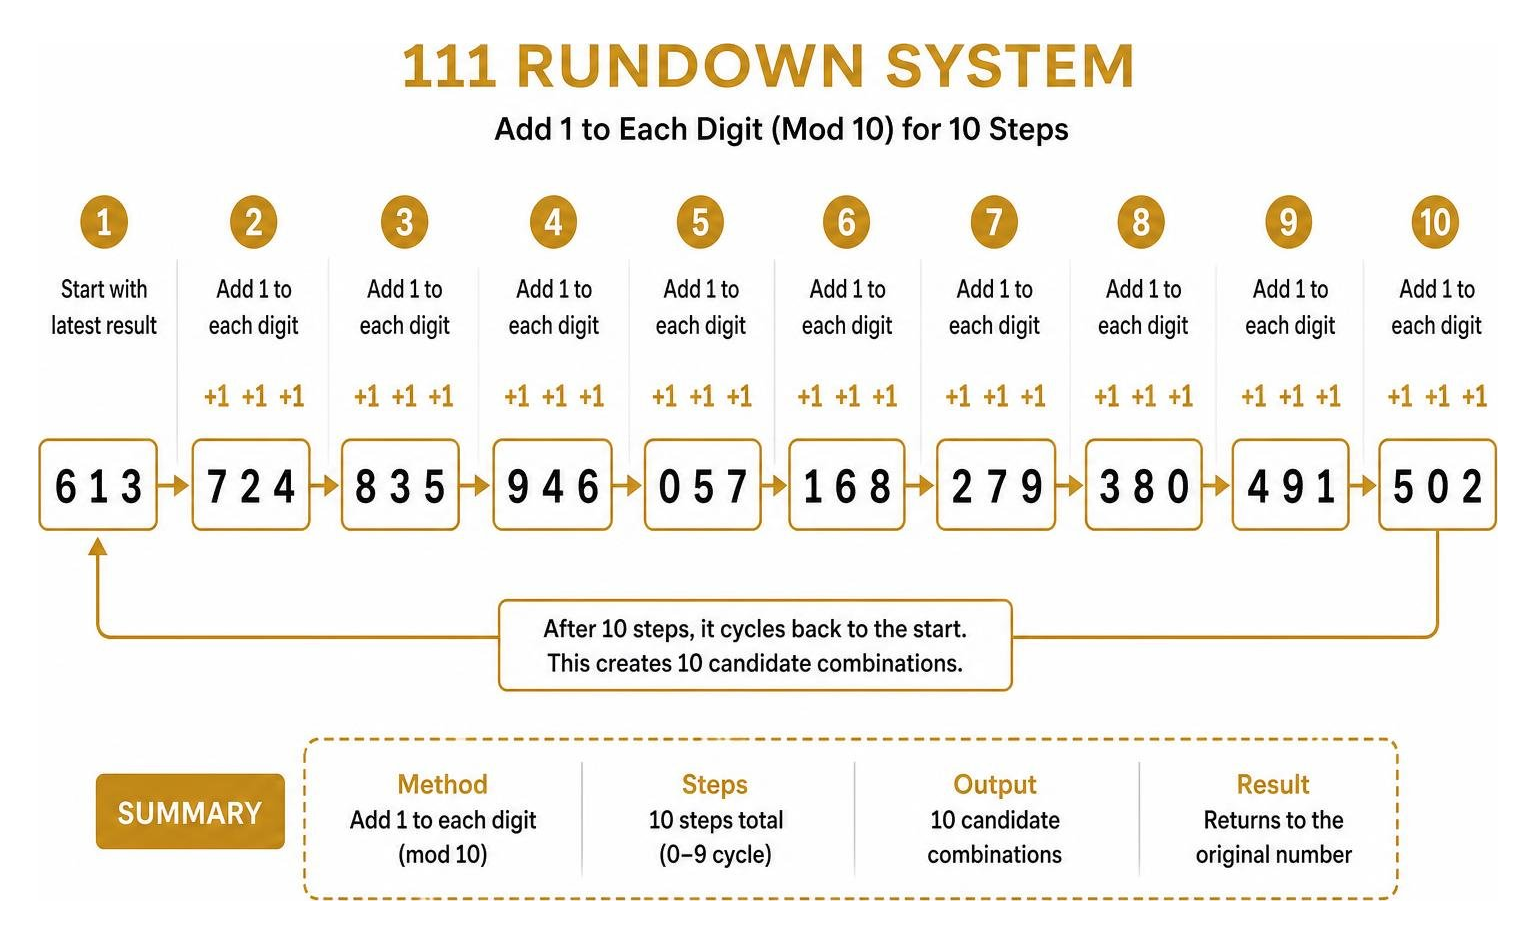
- 111 Rundown: Take the most recent 3-digit winning result (e.g., 6-1-3). Add 1 to each digit independently without carrying over the tens digit (modular 10 arithmetic). Repeating this 10 times cycles back to the original number, creating a grid of 10 candidate combinations (7-2-4, 8-3-5, 9-4-6, etc.).
- 123 Rundown: Instead of adding 1 to each column, add 1 to the first digit, 2 to the second digit, and 3 to the third digit.
- 317 Rundown: Add 3, 1, and 7 respectively to the columns to construct a sequential table.
Players also frequently use Mirror Numbers (calculated by adding 5 to a digit dropping the tens place; e.g., the mirror of 2 is 7) and Date Numbers (summing the month and day of the drawing) to filter their rundown sheets. While these workouts offer a disciplined structure for set selection, statistical testing proves they perform identically to pure random generation over large sample sizes. To monitor current drawing momentum, see our tracker on how to Find Out Which Numbers Are on a Winning Streak Today.
Key Digit Pair Systems and AKDPS Mechanics
A more advanced structural method is the Advanced Key Digit Pair Strategy (AKDPS), detailed in systems like the Advanced Pick 3 Wheeling System.
The core principle of AKDPS relies on identifying the Lowest Winning Digit (LWD) from the most recent Pick 3 draw as a baseline “Key Digit” to locate high-probability two-digit pairs for the next drawing:
- Identify Key Digit: Look at the latest winning draw (e.g., 5-1-0). The lowest single digit is
0. - Consult Pair Matrix: Cross-reference key digit
0against historical pair tables to retrieve recommended candidate pairs (e.g., pairs containing 0 like 02, 05, 08). - Expand Pairs into Combinations:
- Option A (0–9 Endings): Append digits 0 through 9 to each pair to create 200 straight lines.
- Option B (Key Digit Append): Append the Key Digit itself to form double combinations (e.g., 0-0-2, 0-0-5).
- Option C (Hot Digit Append): Append a designated hot digit from positional analysis.
- Option D (Combine Like Pairs): Join two pairs sharing a common digit to build targeted 3-digit boxed sets.
AKDPS allows players to organize pair wheeling mathematically, though final selections must still undergo sum and balance filtering to manage total ticket costs.
Algorithmic Heuristics in Pick 3 Lottery Patterns
In modern lottery analysis, heuristic algorithms automate pattern evaluation using custom parameters. Predictive tools like the Pick 3 Predictor and empirical models published on Grok-3-NEW YORK | Pick3 Master 333 utilize algorithmic weighting to score candidate combinations:
- Lookback Windows: Analyzing recent draw history over defined sample frames (e.g., 30, 90, or 365 days). Shorter windows capture temporary momentum but introduce statistical noise, while 365-day windows align closer to theoretical equilibrium.
- Recent Overlap Penalty: A negative weighting factor applied to combinations or pairs drawn within the last 10 to 50 drawings. Because exact straight repeats within 50 draws occur infrequently, overlap penalties minimize redundant picks.
- Digit Balance & Pair Frequency Scores: Algorithms assign positive weights to lines that combine high-frequency positional digits with under-represented due pairs, categorizing generated picks into tiered probability buckets (Top 5, Next 5, Final 10).
Identifying Strategic Pitfalls in Daily Number Selection
When selecting numbers daily, many casual players fall into predictable behavioral traps that reduce their actual payout efficiency. Avoiding these structural mistakes is one of the most effective ways to refine your Pick 3 lottery patterns strategy.
For answers to broad game mechanics, read our overview on 5 Common Questions About Lottery Results Today Answered.
Common selection mistakes include:
- Playing Extreme Combinations: Choosing numbers like 0-0-0, 9-9-9, 1-2-3, or 7-7-7. While 000 has the exact same 1-in-1,000 mathematical probability as 472, thousands of casual players bet extreme sequences daily. In pari-mutuel states or games with liability caps, hitting an extreme pattern forces you to split the prize pool among hundreds of co-winners, drastically lowering your actual payout.
- Over-reliance on Birthdays and Dates: Restricting number choices to digits 1 through 31 (or 1 through 12 for months). In Pick 3, every position accepts digits 0 through 9, so date-biased picking creates uneven concentration on lower digits while ignoring 0, 4, 5, 6, 7, 8, and 9. We discuss similar selection biases in our guide on Picking 6 Lucky Numbers for Powerball Without Using Your Birthday.
- Chasing Short-Term Repeating Numbers: Continuously re-betting the exact straight combination that won yesterday. While straight numbers do occasionally repeat in back-to-back draws, the probability remains fixed at 1 in 1,000 on every draw.
Overcoming Errors When Evaluating Pick 3 Lottery Patterns
To avoid these common pitfalls, structure your number selection using objective mathematical rules rather than emotional preferences:
Balancing your selections across these statistical baselines ensures your tickets cover standard outcome distributions without falling into popular player bias traps.
Bankroll Management and Long-Term Gaming Strategy
Because all Pick 3 wagers carry a negative expected return (returning roughly $0.50 per $1 wagered over long time horizons), sound bankroll management is the single most important factor for controlling risk. Pattern analysis helps select tickets, but discipline preserves your funds.
Key bankroll practices for long-term play include:
- Establish a Strict Gaming Budget: Set a weekly or monthly entertainment allowance that you can afford to lose completely. Never play with money allocated for essentials.
- Balance Straight and Box Bets: Playing straight-only tickets leads to high variance and long losing streaks. A balanced strategy pairs 1 or 2 boxed plays (to maintain hit frequency) with 1 or 2 straight picks (for higher payout upside).
- Bank Winnings Promptly: When you hit a winning ticket, isolate your initial stake and bank the profit rather than immediately rolling the entire payout back into higher-volume wagering.
- Avoid the Martingale System: Doubling your bet after every loss to recoup past expenditures is dangerous in fixed-odds lottery games. Long losing streaks can quickly deplete your bankroll.
Some players turn to alternative selection methods for fun; you can explore our lighthearted take on How to Pick Winning Lottery Numbers According to the Stars. However, disciplined tracking of profits and losses in a simple spreadsheet remains the most practical tool for any player.
Frequently Asked Questions About Pick 3 Patterns
What is the most common sum range for Pick 3 winning combinations?
The most common sum range is 10 through 17, which accounts for approximately 50% of all 1,000 possible Pick 3 combinations. Sums 13 and 14 are the single most frequent individual totals, each containing 75 straight permutations (7.5% of outcomes each).
Do rundown strategies guarantee a higher hit rate than random selection?
No. Rundown strategies (such as the 111, 123, or 317 workouts) offer a structured, systematic method for picking numbers, but they do not alter the physical randomness or underlying 1-in-1,000 odds of the drawing machine.
What are the exact odds of hitting a double digit versus a single digit?
A 6-way single box bet (three unique digits) has winning odds of approximately 1 in 167. A 3-way double box bet (two identical digits) has winning odds of approximately 1 in 333. Overall, double-digit combinations naturally occur in 27% of all Pick 3 draws.
Conclusion
Analyzing Pick 3 lottery patterns offers an engaging, structured way to understand how three-digit lotteries operate. By exploring single versus double distributions, positional heatmaps, sum ranges, and pair wheeling systems like AKDPS, players can make informed choices about wager coverage and ticket selection.
However, maintain mathematical realism: no pattern system or historical workout can alter the fundamental 1-in-1,000 odds or overcome the built-in house edge. Treating lottery play as a form of entertainment, avoiding common player selection biases, and practicing strict bankroll management ensure your gaming remains fun and responsible.
For more media breakdowns, gaming reviews, and data-driven analysis, explore our comprehensive collection of coverage at Apex Observer News – Analytical Reviews & News.