


Why Corporate Debt Market Trends in 2026 Are Reshaping How Businesses Borrow
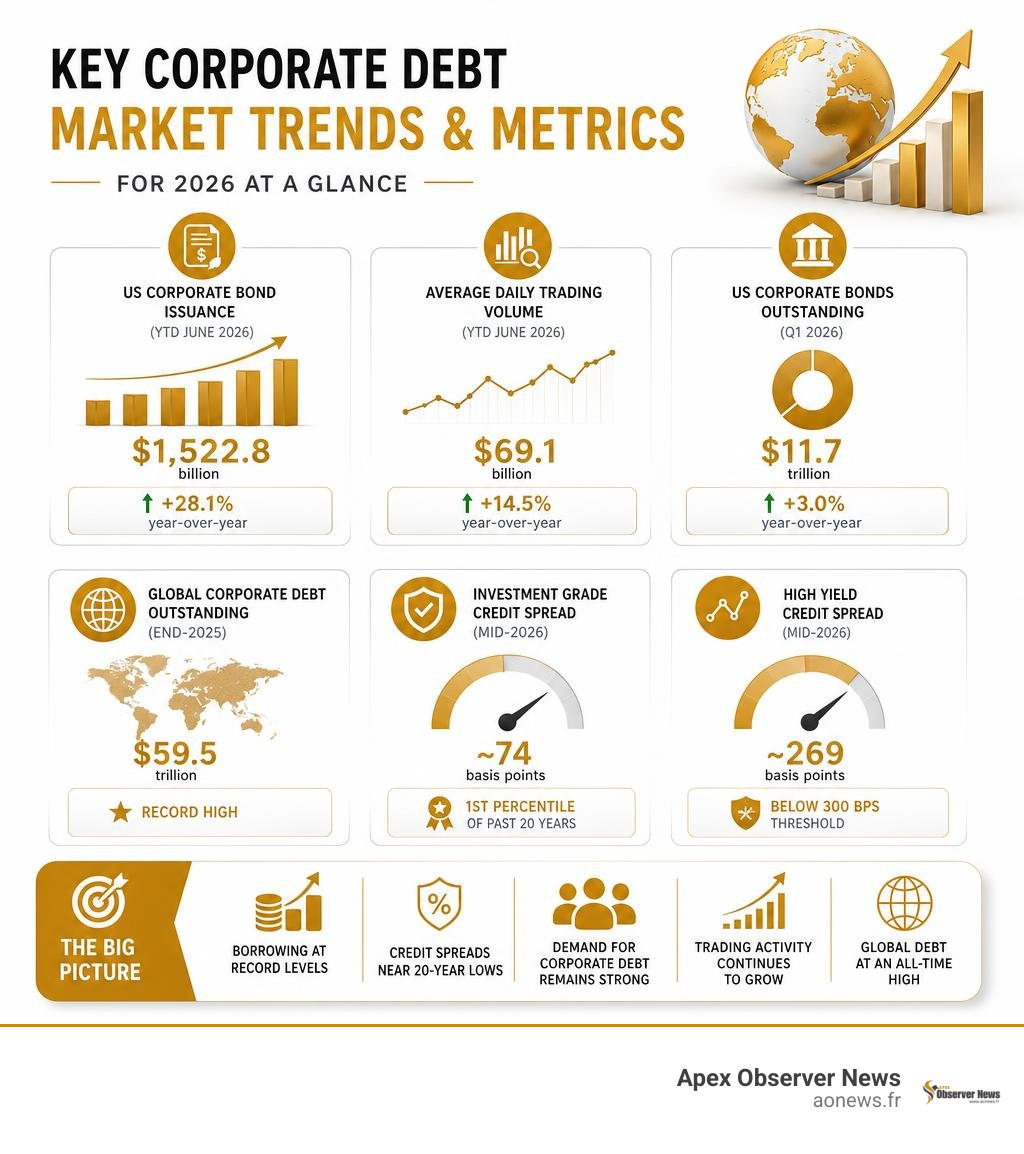
Here is a quick snapshot of where corporate debt markets stand right now:
| Metric | Current Figure | Change |
|---|---|---|
| US Corporate Bond Issuance (YTD June 2026) | $1,522.8 billion | +28.1% year-over-year |
| Average Daily Trading Volume (YTD June 2026) | $69.1 billion | +14.5% year-over-year |
| US Corporate Bonds Outstanding (Q1 2026) | $11.7 trillion | +3.0% year-over-year |
| Global Corporate Debt Outstanding (end-2025) | $59.5 trillion | Record high |
| Investment Grade Credit Spread (mid-2026) | ~74 basis points | 1st percentile of past 20 years |
| High Yield Credit Spread (mid-2026) | ~269 basis points | Below 300 bps threshold |
The global economy has rarely looked this contradictory from a credit perspective.
On one hand, geopolitical tensions are elevated. Interest rates remain high. And corporations are borrowing at record levels. On the other hand, the price investors demand to take on that credit risk — the spread above government bond yields — is near its lowest point in two decades.
That disconnect is the central story of corporate debt market trends in 2026. Global corporate borrowing hit USD 13.7 trillion in 2025 alone, the highest amount ever recorded. Yet credit spreads remain compressed, volatility in bond markets has been short-lived, and demand for corporate debt continues to surge.
Why is this happening? What does it mean for businesses that rely on debt markets? And what risks are quietly building beneath the surface?
This guide breaks it all down — from the AI infrastructure borrowing wave to structural shifts in how bonds are traded and who is buying them.
I’m Faisal S. Chughtai, a digital strategist and founder of ActiveX with a background spanning financial markets analysis, business development, and digital content — including in-depth work covering corporate debt market trends and capital market dynamics. In the sections ahead, I’ll walk you through everything businesses and investors need to understand about where credit markets stand today and where they are heading.
Similar topics to corporate debt market trends:
- Federal Reserve interest rates
- Recession risk economic indicators
- Growth stock market rally
Mid-2026 Macro Snapshot: Issuance, Volume, and Record Debt Levels

When we look at the primary debt markets through the middle of 2026, the overall scale of issuance and trading volume is staggering. Global total corporate debt outstanding reached a staggering $59.5 trillion by the end of 2025, composed of $36.4 trillion in corporate bonds and $23.1 trillion in syndicated loans. Total global corporate borrowing in 2025 alone hit $13.7 trillion ($6.8 trillion in corporate bonds and $7.0 trillion in syndicated loans).
Rather than slowing down due to sticky interest rates, corporate bond primary issuance has accelerated dramatically across major global economies.
Key Statistics Driving Corporate Debt Market Trends
Data compiled by industry associations shows that year-to-date US corporate bond issuance through June 2026 hit $1,522.8 billion, representing an explosive 28.1% year-over-year increase. Average daily trading volume (ADV) jumped to $69.1 billion, a 14.5% year-over-year gain, while total US corporate bonds outstanding reached $11.7 trillion in Q1 2026. For a complete statistical breakdown of market clearing volumes, refer to the US Corporate Bonds Statistics report.
This surge in trading liquidity and market depth is helping companies raise fresh debt capital with ease. You can follow real-time updates on market broad-market conditions in our guide on Market Watch Todays Top Financial News Update.
The Great Refinancing Wall and Interest Rate Convergence
A major factor pushing corporate treasurers to issue debt today is the impending maturity wall. Between 2026 and 2028, approximately 24% of investment grade debt and 31% of non-investment grade debt will mature globally, requiring refinancing.
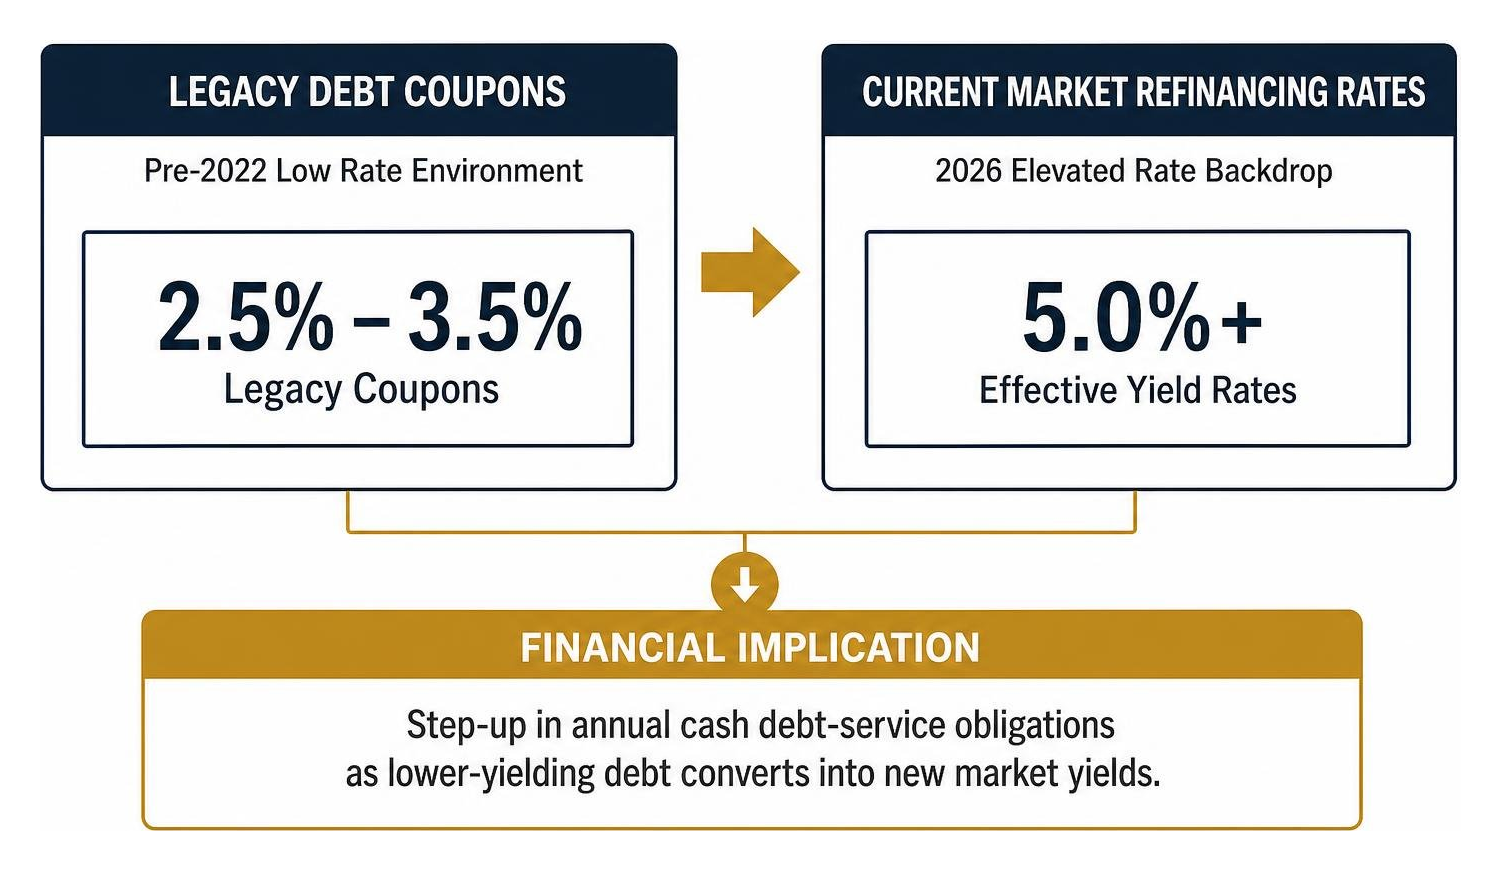
As legacy debt issued during the ultra-low rate environment matures, firms are resetting their borrowing costs higher. However, the gap between coupon costs on legacy debt and current issuance yields has narrowed. At the end of 2025, over 50% of outstanding global investment-grade corporate bonds carried coupons above 4%, compared to under 25% in 2021. For a detailed breakdown of global debt structure, see the Corporate debt market outlook in a transforming world report.
The Paradox of Compressed Spreads: Why Risk Premiums Are at Record Tights
Despite elevated macroeconomic and geopolitical crosscurrents, corporate credit spreads sit near historical tights. Option-adjusted spreads (OAS) for US investment-grade credit compressed to around 74 basis points (0.74%), landing in the 1st percentile of the past 20 years. Meanwhile, high-yield spreads hover near 269 basis points—a level seen only 5% of the time since 2000.
Decomposing Credit Spreads: Default Risk vs. Liquidity Premia
To understand why spreads are so tight, we must look at what makes up a credit spread:
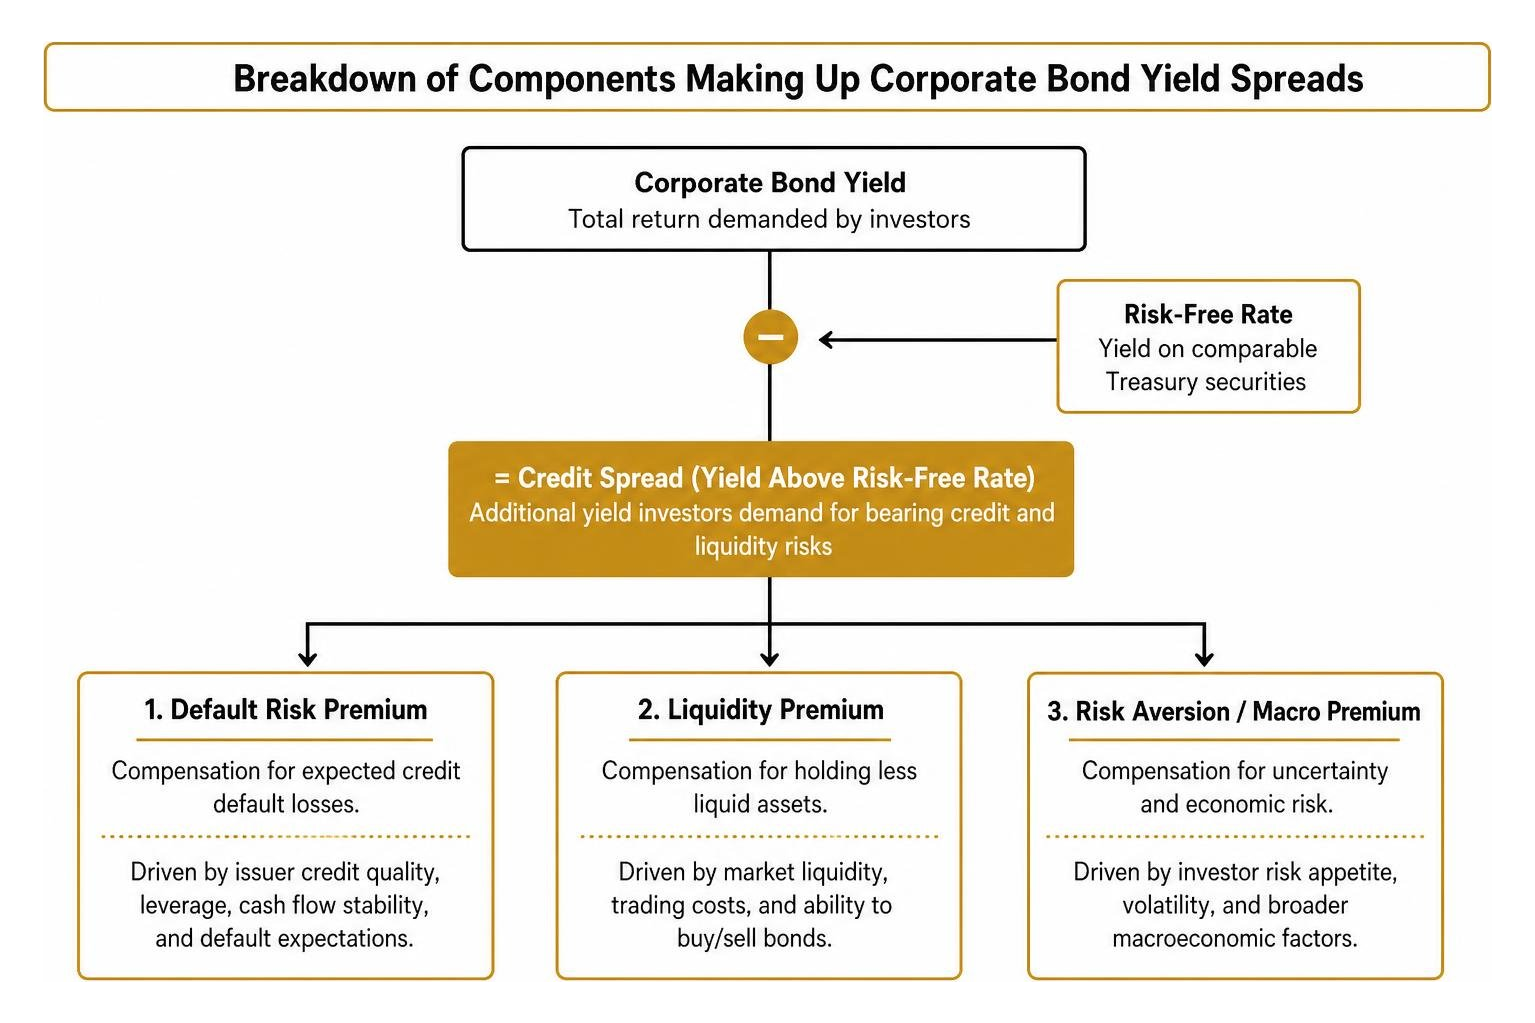
- Default Risk Premium: The expected compensation for credit default losses. Corporate balance sheets remain resilient with strong interest coverage and cash reserves, keeping default expectations low.
- Liquidity Premium: The compensation demanded for holding less liquid assets. Electronification and portfolio trading have reduced bid-ask spreads dramatically—from an average of 77 basis points in 2013 down to 33 basis points by end-2025.
- Risk Aversion / Risk-Free Rates: Nominal Treasury yields above 4.5% to 5.0% provide attractive “all-in” total yield for institutional buyers like insurers and pension funds. When the risk-free rate generates over 85% of total yield, buyers focus less on extracting a wider credit spread.
An in-depth analysis on this spread anomaly can be explored at Credit Spreads at Record Tights: The 74 Basis Point Question – Khan Capital. If you are looking to refresh your underlying fixed-income concepts, check out our resource on A Comprehensive Guide to Investment Basics.
Corporate Debt Market Trends in Credit Quality and Sector Dispersion
Beneath the tight index averages, significant dispersion exists across rating cohorts and industries:
- BBB Rating Segment: Investment-grade upgrades have outpaced downgrades, but the BBB cohort remains sizable as firms manage leverage carefully.
- High Yield & Leveraged Loans: High-yield bonds and loans have delivered solid returns year-to-date due to high coupon carry, but CCC-rated loans have suffered losses, reflecting clear market tiering.
- Sector Divergence: Financials offer incremental yield pickup over Industrials, while power generation and utilities attract high demand to support expanding technology infrastructure.
To evaluate broader macroeconomic context, review our analysis on The Ultimate Guide to Recession Risk Economic Indicators.
How Technology and Market Structure Are Changing Corporate Credit

Structural shifts in electronic trading, algorithmic pricing, and institutional market-making have altered credit market liquidity. The proportion of outstanding US investment-grade bonds that did not trade on a weekly basis dropped from 30% in 2016 to just 10% in 2025.
The AI Infrastructure Boom and Debt Concentration
Artificial intelligence capital expenditures are driving unprecedented corporate borrowing. Nine major technology hyperscalers are projected to spend USD 4.1 trillion in capex between 2026 and 2030. If half of those capital needs are debt-financed, borrowing by those nine issuers alone would represent roughly 15% of historical global gross corporate bond issuance per year.
This massive funding requirement spans multiple industries:
- Technology & Cloud Providers: Issuing multi-tranche unsecured bonds to build AI data center clusters.
- Utilities & Power Producers: Raising debt capital to upgrade electrical grids and build dedicated energy facilities for compute workloads.
- Communications Infrastructure: Securing term loans and bonds for fiber buildouts and network infrastructure.
Detailed analysis of fixed income positioning amid tech capex surges is available in the Breckinridge Capital Advisors | Q3 2026 Corporate Bond Market Outlook. You can explore where capital is flowing across sectors in Where the Growth Is in 2026 and Beyond.
Are Bond Markets Behaving More Like Equity Markets?
As debt issuance concentrates among top megacap tech firms, bond price movements are exhibiting higher correlation with equity price dynamics. In distance-to-default pricing models, corporate bond hedge ratios have tightened, causing investment-grade bonds of mega-cap tech issuers to trade with co-movements similar to high-grade equity instruments.
Learn more about how financial institutions utilize advanced quantitative models in The Algorithmic Banker AI and Machine Learning in Finance.
Strategic Implications of Emerging Corporate Debt Market Trends
The broader shift toward private direct lending, non-bank financial intermediation, and automated fund structures carries major strategic consequences for corporate borrowers and institutional investors alike.
Shifts in the Investor Base and Vulnerability During Stress
The corporate investor base has migrated away from traditional buy-and-hold institutional insurance funds toward open-ended bond ETFs, mutual funds, and principal trading firms. While this structure lowers secondary trading costs during normal market periods, open-ended liquidity features create potential vulnerabilities during market stress, when sudden fund redemptions can widen secondary spreads quickly.
To understand macro capital flows, review The Future of Capital and Why Energy and Pension Markets Are Shifting. Additional quarterly market intelligence can be found in BlackRock’s Progress, with pressure points: report.
Evolution of Loan Covenants and Credit Documentation in 2026
Documentation standards across bank loans and broadly syndicated credit facilities have adapted to changing market conditions:
- Portability Mechanics: Sponsors are requesting portability clauses—allowing debt to remain intact during company sales without triggering change-of-control redemptions—though lenders enforce strict leverage and liquidity hurdles.
- UCC Article 12 Implementation: Adoption of updated Uniform Commercial Code standards provides clearer frameworks for establishing perfected security interests in digital assets and electronic records.
- Tiered Lender Cooperation Agreements: Out-of-court restructurings increasingly rely on tiered creditor agreements that reward early signatories with specific fee preferences during debt realignments.
Track covenant changes across private and public credit markets via Loan Market Covenant Trends: 2Q26 – LSTA.
Frequently Asked Questions About Corporate Debt Conditions
How are current corporate debt market trends affecting borrowing costs for mid-sized firms?
While mega-cap tech issuers access public markets at tight spreads, middle-market companies rely heavily on private credit and syndicated loans. Because these loans carry floating rate benchmarks, total interest expenses remain elevated despite tight credit risk spreads.
Why are corporate bond credit spreads so narrow despite geopolitical uncertainty?
Tight spreads reflect solid balance sheet fundamentals, strong corporate earnings, low default rates, reduced liquidity premia from automated trading, and intense buyer demand driven by high all-in baseline yield levels.
What risks does massive AI capital expenditure pose to corporate debt stability?
Massive debt-funded AI capital expenditure creates supply concentration risks. If revenue generation from AI buildouts trails capital spending timelines, balance sheet leverage could increase, leading to credit rating downgrade pressures for heavy issuers.
Conclusion
Navigating current corporate debt market trends requires balancing historical yield opportunities with careful risk selection. While all-in corporate yields offer attractive income potential, tight credit spreads leave minimal room for credit execution mistakes.
Whether refinancing existing debt walls, funding digital transformation, or evaluating fixed-income allocations, market participants benefit from maintaining active credit screening and disciplined balance sheet practices.
For continuous coverage of financial markets, corporate policy, and capital developments, Explore Business Insights at Apex Observer News.

[…] For businesses and treasuries navigating cross-border investments, understanding these underlying dynamics is as critical as knowing What Every Business Needs to Know About Debt Markets. […]